The two most watched economic indicators were released a few weeks ago. One was the change in GDP from the preceding quarter reported by the BEA , the second was the employment summary released by the BLS.
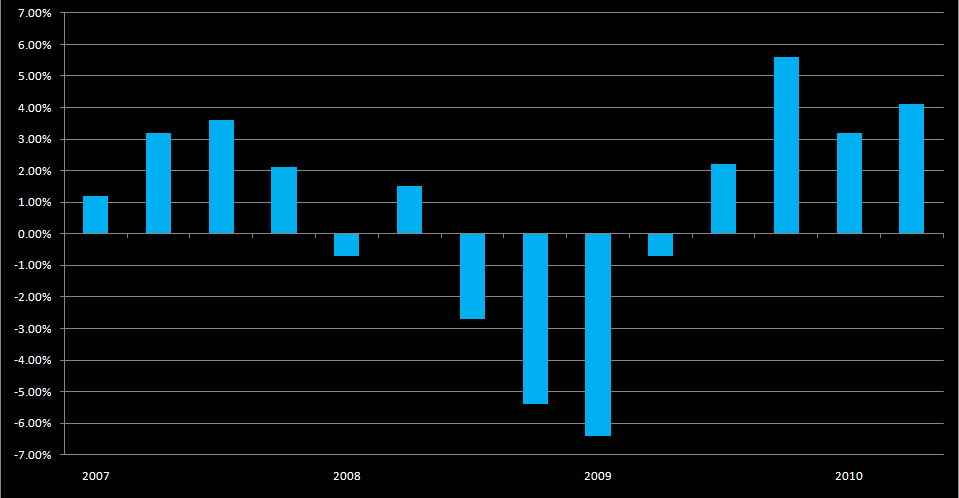
First I will begin with the BEA report [link]. It states that the economy grew by an annualized rate of 3.2% in the first quarter of 2010, or the period from January to March. This is in contrast to the 5.6% growth in the final quarter of 2010 from October to December. The increase comes from consumption expenditures and private investment. Negative figures were posted for imports and a decrease in government spending, which in total took roughly 1% off of the GDP figure. One particularly concerning fact is investment in residential homes shrank, further evidence of a turbulent housing market nearly 1 and a half years after the initial pop of the housing bubble.
Below is a chart showing growth in RGDP since the first quarter of 2007. The last bar is a projection, and is not an official BEA figure.
While economic growth continues, change in the unemployment rate seems to be lagging. After 9 months of continuous growth, the unemployment rate continued to climb into the double digit range, peaking at 10.1% in October of 2009. For the first three months of 2010, the unemployment rate remained at 9.7%. In April, the rate increased again to 9.9%. The Bureau of Labor Statistics report is located here [link].
The chart below shows the change in the unemployment rate since January of 2007;

The BLS reports that discouraged workers once became optimistic, and restarted their job search, which pushed the unemployment rate up.
The second measure we have to use is net job gains. For March and April there were sharp gains in the net jobs figure, although the unemployment rate did not go down. The numbers for the net change in payroll employment are included in the previous link. Both March and April posted gains of over 200,000 jobs for 520,000 jobs added in the past two months. Around 150,000 of these jobs were related to the 2010 Census.
Below is a chart showing net payroll change since 2007;

This image in particular conveys just how painful the recession was on the job market. In fact, since the recession began nearly 9 million jobs have been lost. And while figures from the last two months are promising, the road to recovery is going to be a long and painful one for many Americans...
No comments:
Post a Comment