Friday, July 30, 2010

State of the Economy: 2010

2010 is the year of economic recovery, or so we are told. Despite increasingly optimistic economic forecasts, the economy has failed to deliver strong results.

Today [July 30, 2010] the BEA released the advance estimate for GDP figures, along with their annual revision of GDP. These changes reach as far back as 2007, with the recession being somewhat more severe than originally thought and the subsequent recovery being weaker.

These changes were far reaching and too numerous to list, however, the updated figures can be viewed here:

http://bea.gov/national/nipaweb/TableView.asp?SelectedTable=1&FirstYear=2009&LastYear=2010&Freq=Qtr

Additional changes were made to methodology that makes the GDP figures include more components of the Census Bureau's QSS. Thus, GDP figures from the first quarter of 2010 onward will be calculated in a slightly different - but more encompassing manner - allowing the figures to come out higher than they would have been previously during growth, and lower during periods of downturn.

Perhaps the greatest revelation in the new figures is that the depth of the recession has been relocated. Instead of focusing on the last portion of 2008 and the first quarter of 2009, the most damage was done in the final two quarters of 2008. The economic decline decelerated immediately with the new year to only -4.9% growth as opposed to initial estimates closer to -6.5%.

Ultimately growth in the 1st quarter of 2010 was moved up to 3.7% from 2.7%, and the first estimate for the 2nd quarter of 2010 comes out to be 2.4%.

New chart including new figures;

Wednesday, May 12, 2010

Economy Improves In April

**Notice: Links to original BEA and BLS reports change periodically as monthly statements are released. As such, they may not link to the original statistics cited. However, you can use the historical data links on both sites to view previously cited figures.

The two most watched economic indicators were released a few weeks ago. One was the change in GDP from the preceding quarter reported by the BEA , the second was the employment summary released by the BLS.

First I will begin with the BEA report [link]. It states that the economy grew by an annualized rate of 3.2% in the first quarter of 2010, or the period from January to March. This is in contrast to the 5.6% growth in the final quarter of 2010 from October to December. The increase comes from consumption expenditures and private investment. Negative figures were posted for imports and a decrease in government spending, which in total took roughly 1% off of the GDP figure. One particularly concerning fact is investment in residential homes shrank, further evidence of a turbulent housing market nearly 1 and a half years after the initial pop of the housing bubble.

Below is a chart showing growth in RGDP since the first quarter of 2007. The last bar is a projection, and is not an official BEA figure.


While economic growth continues, change in the unemployment rate seems to be lagging. After 9 months of continuous growth, the unemployment rate continued to climb into the double digit range, peaking at 10.1% in October of 2009. For the first three months of 2010, the unemployment rate remained at 9.7%. In April, the rate increased again to 9.9%. The Bureau of Labor Statistics report is located here [link].

The chart below shows the change in the unemployment rate since January of 2007;


The BLS reports that discouraged workers once became optimistic, and restarted their job search, which pushed the unemployment rate up.

The second measure we have to use is net job gains. For March and April there were sharp gains in the net jobs figure, although the unemployment rate did not go down. The numbers for the net change in payroll employment are included in the previous link. Both March and April posted gains of over 200,000 jobs for 520,000 jobs added in the past two months. Around 150,000 of these jobs were related to the 2010 Census.

Below is a chart showing net payroll change since 2007;


This image in particular conveys just how painful the recession was on the job market. In fact, since the recession began nearly 9 million jobs have been lost. And while figures from the last two months are promising, the road to recovery is going to be a long and painful one for many Americans...

Monday, May 10, 2010

Red State Socialism?

One could not have caroused the internet to satisfy their desire for politics without coming across the concept of red and blue states. It is a well known concept that red represented the Republican party, while blue represented that of the Democrats. Such was not always the case, after Reagan's landslide re-election, the results were dubbed a "sea of blue". Reagan was no Democrat, but at the time blue represented the incumbent party, while red represented the aggressor party.

This all changed in 2000. With the hotly contested battle for the White House raging on following election day, the map of red and blue states was constantly plastered on our television screens, or in many cases our AOL homepage (heh). As the weeks dragged on, seeing Bush and the Republicans with red states and Gore and the Democrats with blue states established what would become a permanent fixture of American politics; the red state/blue state divide.

The concept is simple, we classify states for political purposes based only on what party they vote for in presidential elections.

Some time ago, a particular graphic appeared all over the internet, and has become a staple of many red state vs. blue state confrontations;


After some research, I traced the origin of the chart to the Democratic Action Team.

The chart basically shows the difference between federal fund allocation to each state, as well as the federal tax revenue generated by each state. The data is from 2005, years before the economy collapsed.

The U.S. Census Bureau prepares a Consolidated Federal Funds Report every year, which outlines total federal expenditure by state. Data since 1993 is available for viewing online [link]. The IRS records tax revenue by state, with data viewable here [link]. The latest complete figures are available for 2008. The Census will release 2009 data on spending in June.

For extra fun, I put together my own chart using Excel, which is updated for 2008 and includes the swing states for the 2008 election;


As you can see, there is quite a change in only 3 years. Part of it pertains to the recession in the later part of 2008, which required significant emergency spending by the federal government, and a drop in revenues throughout the states. Utah appears to have the most balanced spending ratio, receiving exactly $1.00 for every $1.00 in taxes. 8 other states also have decent ratios, when considering the range of within 10¢ of $1.00 as ideal.

Thursday, April 8, 2010

Paul Krugman - "Debunking the Reagan Myth"

Paul Krugman has practically devoted his life to economics. He was the recipient of the Nobel Prize in economics in 2008, and actively writes opinion pieces for the New York Times. Additionally, he is a self-professed Liberal and makes no effort to mask his strong support and approval of President Obama and the Democrats.

However, his background is not the topic today. Instead, a piece he wrote in January of 2008 and published to the NYT opinion section takes the limelight. You can view the original article here [link]. There are a number of rather unusual pieces of information within the article that will be individually addressed here in the interest of the truth.

The target of the article is none other than former POTUS Ronald W. Reagan (1981-1989) in the criticism of Conservative revisionism.

"Maybe Mr. Obama was, as his supporters insist, simply praising Reagan’s political skills. (I think he was trying to curry favor with a conservative editorial board, which did in fact endorse him.) But where in his remarks was the clear declaration that Reaganomics failed?

For it did fail. The Reagan economy was a one-hit wonder. Yes, there was a boom in the mid-1980s, as the economy recovered from a severe recession. But while the rich got much richer, there was little sustained economic improvement for most Americans. By the late 1980s, middle-class incomes were barely higher than they had been a decade before — and the poverty rate had actually risen."

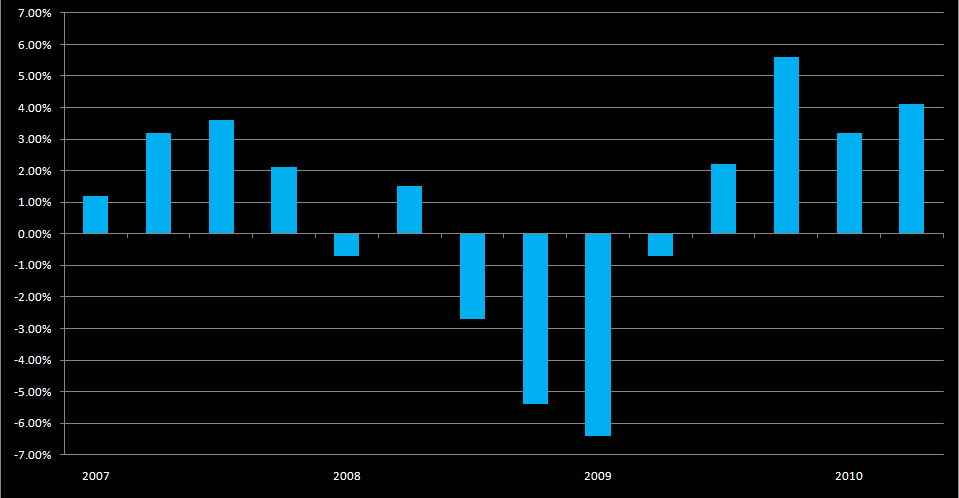
The term one-hit wonder is probably not all that much of a stretch. The economy soared following the early 80s recession. Growth in real Gross Domestic Product (the primary measure of US economic growth) for 1983 and 1984 was the best showing in many years. The first quarter of 1983 gave us 5.1% growth, the rest of 1983 posted 9.3%, 8.1%, and 8.5% respectively. Economic boom continued into 1984, with another 8.0% and 7.1% spurt before returning to more average levels of around 3.5% until mid-1985.

All of these quarterly figures can be found at the Bureau of Economic Analysis website, specifically in table 1.1.1, located here [link].

Krugman next states that middle class incomes had risen very little in the 80s. In fact, middle class income rose from $21,083 in 1980 to $34,206 by 1989. That is just shy of the gains in the 90s, and considering the 1981-1982 recession put a large dent in the economy across the board, the gains are quite impressive. Once again, our government provides excellent data for us to use, this time through the Census Bureau. You can find income information here.

The final assertion by Krugman is that the poverty rate had risen by the late 80s to a point higher than at the start of that decade. It is common knowledge the recession has a greater effect on the poorest quintiles than anyone else, thus poverty rates naturally increase during recession and decrease during periods of expansion. One thing to note is that poverty rates are measured in two different ways; one considers all individuals regardless of their families (this includes individuals living alone or unrelated cohabitants; and also young adults and the elderly). The second measure includes only those in families. The family poverty rate changes very little over time, and seems to be immune to recession and economic expansion. The poverty rate in 1980 stood at 13%, and by 1989 it had changed very little, down to only 12.8%. However, the peak of the recession put the poverty rate at 15.2%, and it had been declining since 1983. The family poverty rate was the same in 1980 and it was in 1989, exactly 11.5%, down from a peak of 13.5% during the recession.

However, you need not take my word for it, once again the Census Bureau has done all the work for us, poverty rates can be found here [link].

"For example, I’m not sure what “dynamism” means, but if it means productivity growth, there wasn’t any resurgence in the Reagan years."

Labor productivity is essentially output per labor hour. Unfortunately the United States suffered from persistent stagflation in the late 70s, and labor productivity remained fixed in the neighborhood of 41 units from 1977-1980. By 1989, productivity had surged to 56.1 units. [Source unknown, possibly BLS - will add at a later date].

"I understand why conservatives want to rewrite history and pretend that these good things happened while a Republican was in office — or claim, implausibly, that the 1981 Reagan tax cut somehow deserves credit for positive economic developments that didn’t happen until 14 or more years had passed."

It would be nice to know where exactly Krugman gets his data, as every indicator shows that the 1980s were a positive decade across the board (the 14 years referred to is the begining of the Dot Com bubble). However, Reagan's 1981 tax cut had a deeper importance, not such much the actual cutting of taxes, but rather other provisions in the bill that greatly simplified the tax code. Perhaps more important was the indexing of tax brackets, which reduced so called "bracket creep" incurred during the 70s. Inflation pushed families into ever higher tax brackets, which put considerable strain on the lower income classes. The highlights of the Economic Recovery Tax Act of 1981 (ERTA) are outlined at the Tax Policy Center, another excellent source for information on tax bills, located here [link].

"Like Ronald Reagan, President Bush began his term in office with big tax cuts for the rich and promises that the benefits would trickle down to the middle class. Like Reagan, he also began his term with an economic slump, then claimed that the recovery from that slump proved the success of his policies."

This quote is an interesting statement, especially considering the article far predates Obama's election, his victory in the primaries, and the economic collapse following the financial crisis. One could wonder if Krugman will credit Obama with launching successful economic policy, despite alluding here to the fact that recovery is inevitable regardless of what a president does.

Introduction to "Politics of the Economy"

Welcome to Politics of the Economy, a blog completely devoted to the political aspect of the economy!

For those of us who seek a more rational and in-depth approach to understanding the political aspect of managing the US economic juggernaut, choices are few. Here, I devote this blog to explaining economic trends over the past 40 or so years, as well as comparing them to the political atmosphere at the time. It is no secret that the president, as well as Congress, has a firm command of directing the economy, as the initiatives of both can directly contribute to economic growth or recession.

There are a lot of myths and misconceptions out there related to the economy. Many of these myths are perpetuated by right wing and left wing political commentators who try to smear each other on a constant basis. I feel this is unfair to the American population who listen to them, as actual history and statistics takes a back seat to politics.

Most of what you will find here will refute posts made elsewhere, although some posts may contain other information or explanations of various forms of economic news. Please feel free to comment, I readily encourage counter arguments or other sources of information.

Thank you, and I hope you enjoy this blog!